Tuesday, August 23, 2011

Profitability of Canadian oil sands

Oil prices have risen dramatically over the past decade while global production has stayed flat and has declined in some maturing oil fields. I've been hearing a lot about oil sands being the answer to this decline, but there are huge costs involved in developing and operating oil sands production. At what crude oil price do oil sands become profitable?

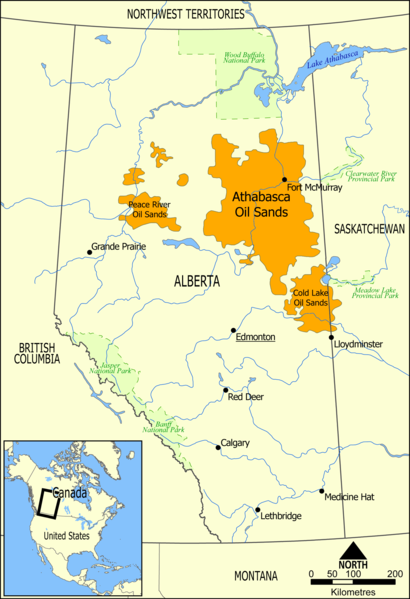
Some background about Athabasca oil sands: located in a remote part of Western Canada, the area has been in production since 1967 and a meteoric rise in oil price over the last decade have made it an attractive place for oil companies to set up shop there. Production increased from 760,000 barrels per day in 2005 (source: Wikipedia) to 1.6 million in 2011, and is projected to reach 3 million by 2020.

A map of Alberta and the Athabasca Oil Sands (Source: Wikipedia)

Unlike conventional crude, which is usually found and produced from an underground reservoir, oil sands (a mixture of bitumen, water, clay and sand) can be dug out with a shovel--literally:

Truck and shovel mining at Albian Sands. (Source: Shell)

It then goes to a refinery where the bitumen is cooked out of the sandy mixture and upgraded to usable crude oil. This type of production costs more than conventional oil production, mainly because a lot of natural gas is needed to heat the bitumen. A more advanced method is to inject steam into the oil sands, which makes it possible for the oil to be drained out of the sands. This is called SAGD (Steam Assisted Gravity Drainage).

What does this all cost? From the Wikipedia article:
In mid-2006, the National Energy Board of Canada estimated the operating cost of a new mining operation in the Athabasca oil sands to be C$9 to C$12 per barrel, while the cost of an in-situ SAGD operation (using dual horizontal wells) would be C$10 to C$14 per barrel.[82] This compares to operating costs for conventional oil wells which can range from less than one dollar per barrel in Iraq and Saudi Arabia to over six in the United States and Canada's conventional oil reserves. 
The capital cost of the equipment required to mine the sands and haul it to processing is a major consideration in starting production. The NEB estimates that capital costs raise the total cost of production to C$18 to C$20 per barrel for a new mining operation and C$18 to C$22 per barrel for a SAGD operation. This does not include the cost of upgrading the crude bitumen to synthetic crude oil, which makes the final costs C$36 to C$40 per barrel for a new mining operation.
So what happens when oil prices go down? This article says what I've been thinking:
The recent steep drop in crude-oil prices isn't good news for Canada's oil-sands industry, which boasts large reserves but requires high up-front costs for development. 
With oil futures prices dropping more than 30% since April from above $110 a barrel to below $80 a barrel Tuesday, profits will be squeezed at several projects and some under construction may be halted if they no longer make economic sense.
What about costs? In 2011, They're going up:
Canadian Oil Sands, which has a 37 per cent interest in the sprawling Syncrude development north of Fort McMurray, Alta., said its results were helped by higher overall oil prices, although production dropped and operating expenses rose. [...] 
In the quarter, operating costs were $37.07 a barrel, compared with $30.93 a year earlier.
Of course, these are just the costs for one company but I'm confident that other's are in the same range. Note that the operating costs mentioned in the Wikipedia article are in the $9-$12 range, so costs have gone up about fourfold over the past five years. (Also note that the costs are in Canadian dollars, making them even higher in US$ terms.) If capital costs have stayed the same, that makes the operational + capital costs (before upgrading) to about US$50/barrel. I'm making a wild guess here but I see $70 in ops + capital + upgrading costs as a lower limit. And then you still need to transport it to the end user...

So at a current WTI price of $85 it's barely profitable to invest in new projects. But the bigger problem is volatility. If you were sure that costs and revenue per barrel would remain constant, you could expect a long-term profit. However both are subject to volatility as they depend on the natural gas price, construction materials, crude oil demand etc. The current situation is that, barrel for barrel, costs are going up and revenues are declining fast.

That leads me to take a look at the bigger picture. The world economy has been in a rough patch for the last four years and this has its effects on crude oil demand--no economic growth, no demand, prices go down. In 2009, the price for WTI, the global oil price benchmark, hit US$40 a barrel, after hitting $147 about six months earlier. The world economy was stuck in reverse after a huge financial crisis the year before and demand plummeted.

This could happen again in 2011: just follow the news about U.S. and European debt crises and their knock-on effect on the economy. Already the WTI price is halfway down to the 2009 lows.

Although back then it didn't stop oil sands producers from operating, it made them reluctant to invest in new projects until the price went back up. If oil hits $40 again--which I think is likely--producers will scratch their head once more and at least take a hard look at their Athabasca expansion plans which, at (my speculative guess of) $70 total cost per barrel, make no business sense.

The big question is how future technological developments and efficiency improvements will be able to bring costs down. For now though, I believe that high costs and high volatility makes it challenging to expand in Athabasca with confidence.

Sunday, May 1, 2011

A tale of two income groups: what do Americans spend on food & energy?

Today I'd like to explore a simple question: What do Americans spend on food and energy? What is the difference between high and low incomes, and what was the situation 25 years ago?

Everybody with a family and a car has seen their costs at the pump and at Wal-Mart go up in recent years. Gas prices are a function of the price of a barrel of oil, which has risen about sevenfold between 1999 and 2008. Fertilizer and agricultural machines are dependent on oil which makes food cost dependent on oil price. So were we better off before than we are now or are we just nostalgic for the good old days?

The Bureau of Labor Statistics (BLS) has some very detailed statistics on America's spending habits (sources: here, here). These tables show the items Americans spend their income on, seperated by income bracket. (Tthey talk about consumer units as opposed to individuals. I'm assuming it's an expensive word for households.)

The table below gives an interesting look in 2009 expenditures per income group: above or below $150,000.

ItemAll consumer unitsbelow $150,000$150,000 and more
Number of consumer units (in thousands)120,847112,3988,447
Income before taxes$62,857$49,826$236,246
Expenditures as % of pretax income:
Food10.111.75.6
Housing26.930.616.4
  Utilities, fuels and public services5.87.02.5
Transportation12.213.87.5
  Gasoline and motor oil3.23.81.4
Source: Consumer Expenditure Survey, U.S. Bureau of Labor Statistics, October, 2010. Analysis: EveryBarrelCounts.blogspot.com

Above 150k was the highest income group stated by BLS, and I consider them to be "the rich". Consumer units earning below that figure I consider "the rest". (Note that less than 7% earn over 150k. Also note that I chose % of pretax instead of posttax, because those numbers didn't seem to differ very much: for example in the top range pre/posttax are given as 236k vs. 222k.)

To me, three items in the above table are essential: food, utilities and gasoline. What is clear is that "poor" families spend more than twice as much of their income on these essentials as "the rich": 22.5% vs. 10.5%.

Now let's look at the same figures in 1984 (source table). Mind you, the highest income bracket is $50,000 or 3x less than today's numbers!

ItemAll consumer unitsbelow $50,000$50,000 and more
Number of consumer units (in thousands)81,17873,6627,516
Income before taxes US$23,464$18,358$73,511
Expenditures as % of pretax income:
Food14.416.78.7
Housing28.732.419.4
  Utilities, fuels and public services7.08.33.6
Transportation18.721.312.4
  Gasoline and motor oil4.65.52.3
Source: Consumer Expenditure Survey 1984, U.S. Bureau of Labor Statistics. Analysis: EveryBarrelCounts.blogspot.com

Again we see a difference between poor and rich: 30.5% of income was diverted to food, utilities and gasoline among the poorest ~90% of Americans while this number was 14.6% for the richest.

So although Americans spend less of their income on essentials today than 25 years ago, the difference between top and bottom incomes is still the same. The poorest 90% spend about 2x as much of their income on essentials compared to the rest. (1984: 30.5% vs 14.6%, 2009: 22.5% vs 10.5%)

Fair? Perhaps--rich people spend a good deal more of income on taxes, which isn't included in these numbers. Will the pressure of food, energy and utilities on income go down in the future? I think we've reached a lower limit. With unemployment in the high single digits, wages won't go up anytime soon--but the price of energy sure will.

Wednesday, April 27, 2011

EROEI of Texas pumpjacks

For a long time I've been wondering about the amount of effort it takes to obtain energy, whether it's pumping oil, digging coal or manufacturing solar panels.

In this first post, I'll explore a simple concept: the Energy Return on Energy Invested (EROEI) of that icon of oil production, the pumpjack. To be more specific, I'll be looking into a Texas pumpjack: how many barrels does it produce in a day, and how much energy is needed to get that energy out?

I'm at this point only interested in the amount of energy required to make the pumpjack go up and down. Of course it took effort (skills, materials, energy) to discover the oil, drill the well and build infrastructure manufacture, but I'll leave that for another time.

Returns
So let's start with the returns. I'm brushing with broad strokes here. According to the Texas Railroad Commission, Texas produced 349 million barrels in 2009 from 157,807 wells. I'm assuming this is not counting the federal offshore fields. Further assuming that ALL Texas oil was produced using pumpjacks, and that there's one pumpjack per well, each pumpjack produced 2212 barrels in 2009--just over 6 barrels a day. Now, by taking the amount of energy released by burning a barrel of oil to be 6.1 GJ, a pumpjack produces 37 GJ worth of energy.

Investment
Now for the energy invested. I'm assuming from this thread that a typical pump jack uses a 40kW electrical motor, running 24/7. Assuming 100% efficiency (!!!) That's 60x60x24x40kWe = 3456 MJ or ~3.5 GJ.

EROEI
Simply dividing the former by the latter, the EROEI of a Texas pumpjack is slightly better than 10:1 IF the energy values of oil and electrical energy can be interchanged without loss.

Of course, crude oil is generally not used for heating or electricity production, and electricity is generally not used to drive a car (although that's changing), so this number can be deceptive--it merely gives an indication.

Conclusion: cut out the middle man?
Concluding this post --and this is me speculating--, it's interesting to note that a fossil-fueled/coal based power station never exceeds 50% efficiency, excluding transportation losses. Coal is by far the most common source of electricity, I'd guess.

That means at least 7 GJ worth of "coal energy" is needed to produce 37 GJ of "Texas crude energy" in one day. A combustion engine converts chemical into mechanical energy at an efficiency of ~33%, so only around 12 GJ of "Texas crude energy" gets released as mechanical energy by  burning 7 GJ of coal, out of an initial 37 GJ.

Which almost means that (and I'm really taking this into the extreme), when you trade in your SUV for a small electric car that runs on coal-generated electricity, you can just as well leave the oil in the ground that would otherwise be used... A.k.a. cut out the middle man... But, as they say, your mileage may vary!

(P.S. Any comments, corrections, suggestions for better data and/or methodology are very welcome!)